
A structured look at growth, inflation, labor, and market signals
Each month, EconPulse aggregates a small set of widely followed economic indicators and evaluates them together, rather than in isolation.
The goal isn’t prediction or persuasion; it’s context. What is supportive, what is concerning, and where signals are mixed.
Executive Summary
Current Regime: Mixed Signals | Neutral Stance
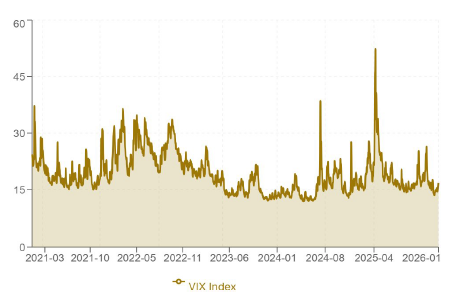
- Volatility remains low
- The yield curve is positively sloped
- Inflation remains elevated
- Consumer confidence is subdued
Taken together, the data suggests a stable but fragile environment, one that warrants attention, not alarm.
Key Data
1Growth & Monetary Policy
GDP growth is modest and slightly below recent averages, while policy rates continue to ease. This combination is neither restrictive nor strongly stimulative; best described as neutral support.
2Labor & Inflation
Unemployment has drifted higher and inflation remains above long-term targets. Neither signal is extreme, but both merit monitoring.
3Credit Conditions
Credit spreads have widened modestly, while delinquency rates remain stable. Credit markets appear functional, not stressed.
4Yield Curve
The yield curve remains positively sloped across maturities, suggesting continued expansion expectations from the bond market.
5Sentiment & Volatility
Consumer sentiment is weak relative to history, even as volatility remains subdued, an interesting divergence worth watching.
6Inflation Hedges & Risk Appetite
Gold has performed strongly year-over-year, while Bitcoin reflects moderate risk appetite rather than exuberance.
What I’m Watching Next
- Consumer confidence relative to labor trends
- Inflation persistence vs. policy easing
- Credit spreads as a stress early-warning signal
The full EconPulse dashboard and interactive charts are updated continuously and available on Pearl Quest. This monthly brief reflects the same framework used in the dashboard, distilled into a narrative format.
Disclaimer
This commentary is for informational purposes only and does not constitute investment advice. Economic data is subject to revision.